How a standard Google Ads tool can save you millions in reduced ad waste

Nils Danielson
Media Operations Director
“Half the money I spend on advertising is wasted; the trouble is I don’t know which half.” – John Wanamaker (1838-1922)
If you ever take the plunge into the intricacies of marketing evaluation, you are almost certain to encounter Wanamaker’s winged words at some point – not surprising considering how accurate his description of the challenge we struggle to tackle still is, more than 100 hundred years after his passing. In this blog post, we will show you how to use the Performance planner to identify the “wasted half”, and potentially save millions in wasted ad spend.
What are marginal returns?
Before we dive into the methodology itself, let’s take a look at the concept of marginal returns. Marginal returns are defined as the return of a one unit increase in investment. If you are not familiar with the concept, chances are that you’ve heard of the law of diminishing returns, that says that the relationship between investment and outcome is never linear: at some point the curve will flatten out and investments will be greater than the outcome, the dreaded point of diminishing returns.
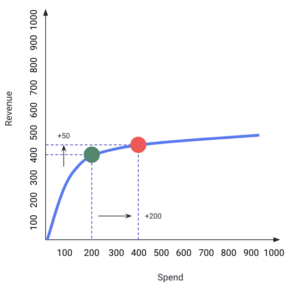
These are not concepts unique to online advertising, but they are extremely important to understand in order to maximise efficiency of your ad spend.
Ironically, we are usually left with no insight to this: ad platforms reports on average COS CPA and ROAS. In the latter case, the calculation is based on the sum of revenue divided by the sum of investments – all good and nothing wrong, but even if the average is on target, you might still have a large share of the investment going to waste: 70 % of the budget might result in a ROAS of less than 100%, where revenue is lower than investment, and you will never know.
The above example might sound extreme, but having done this analysis across a multitude of clients, similar scenarios are much more common than you might think.
How to use the forecasting tool
So, how do you then get insights into this if there are no metrics in e.g. Google Ads you can look at? You use the estimates of the Performance planner, a forecasting tool that allows you to estimate how different budgets affect conversions and revenue.
So, let’s navigate to the performance planner and get our marginal ROAS:
- You’ll find the performance planner in Tools & Settings > Performance planner
- Select a period that is as close as possible to the current date, select search, shopping or PMAX and select Conversion value as key metric. Finally select the campaigns you wish to forecast and click apply.
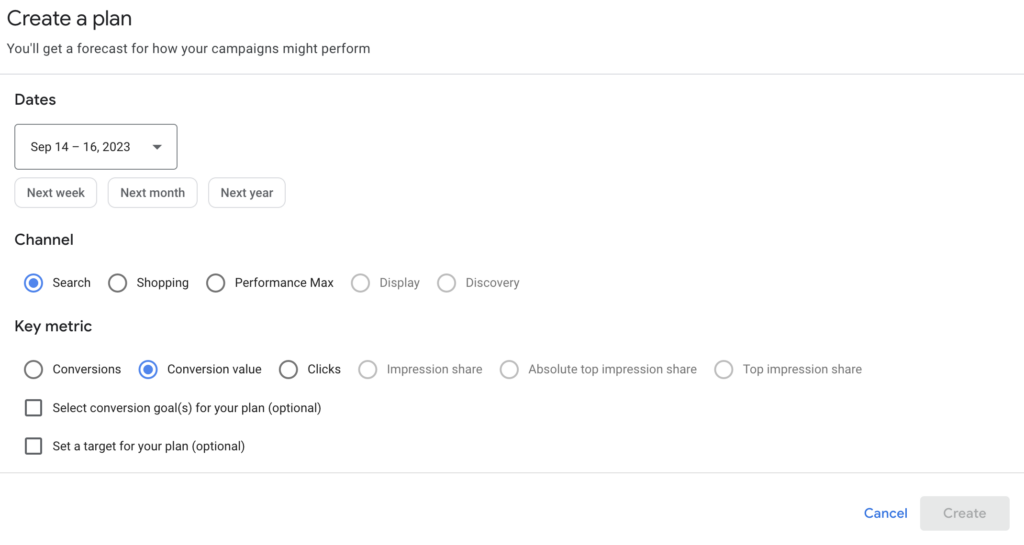
- Now you should have a Spend / Conversion value graph in front of you. Find the grey dot that indicates the current spend

- Move the cursor to the closet point above current spend (the grey dot)
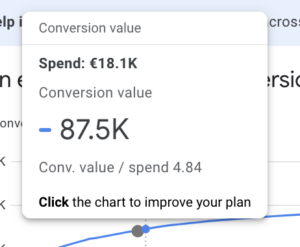
- Take a note on the readings of Spend, Conversion Value
- Move the cursor to a the closest point below current spend
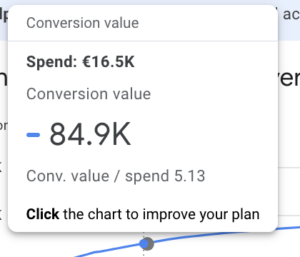
- Note the readings of Spend and Conversion Value
- Subtract spend from the last reading from spend from the first reading
- Repeat for conversion value
- Divide the difference of conversion value with the difference of Spend
- The resulting quotient is your current marginal ROAS. In this example mROAS is ca 160%.
- The formula for our calculation is ΔConversions value / ΔConversions value
Now, how should you interpret this? In short: if you arrive at a number less than 100%, part of your investment is inefficient as the investment is greater than the outcome of revenue: the lower the number, the worse the inefficiency. This does not say what the actual profitable target or budget is, but you can use the other estimation points to identify where mROAS > 100%. Keep in mind that mROAS greater than 100% doesn’t mean mean you’re in the safe zone: If you’re optimising for a ROAS target of 600% and your marginal ROAS (mROAS) is 150%, part of the investment is still way lower from the target you optimise for.
Regardless of what your results tell you, it’s crucial to assess these from a “bang for the buck” perspective; is the money best spent in Google ads, or are there other channels or initiatives (creative updates, branding initiatives etc) that would yield a better return? To maximise efficiency, we should always ask ourselves that question.
Considerations and caveats
Before taking action there are a few things you should be aware of:
- While the simulation is likely based on the best data available, it’s not perfect, and there are inherent limitations, e.g. that it relies on historical data. Always sanity check the output, and keep in mind that the results are indicative rather than exact!
- Finally, remember that the revenue that the ROAS calculation is based on does not equal the actual profit gained from your campaigns: factors like Incrementality, CLV, unaccounted costs etc will influence the final earnings of your campaigns. I dare to guess though that for the majority of advertisers, the actual profit from a campaign will be significantly lower than what’s reported in the ad platform, yet another argument to keep mROAS above 100%!
Other platforms
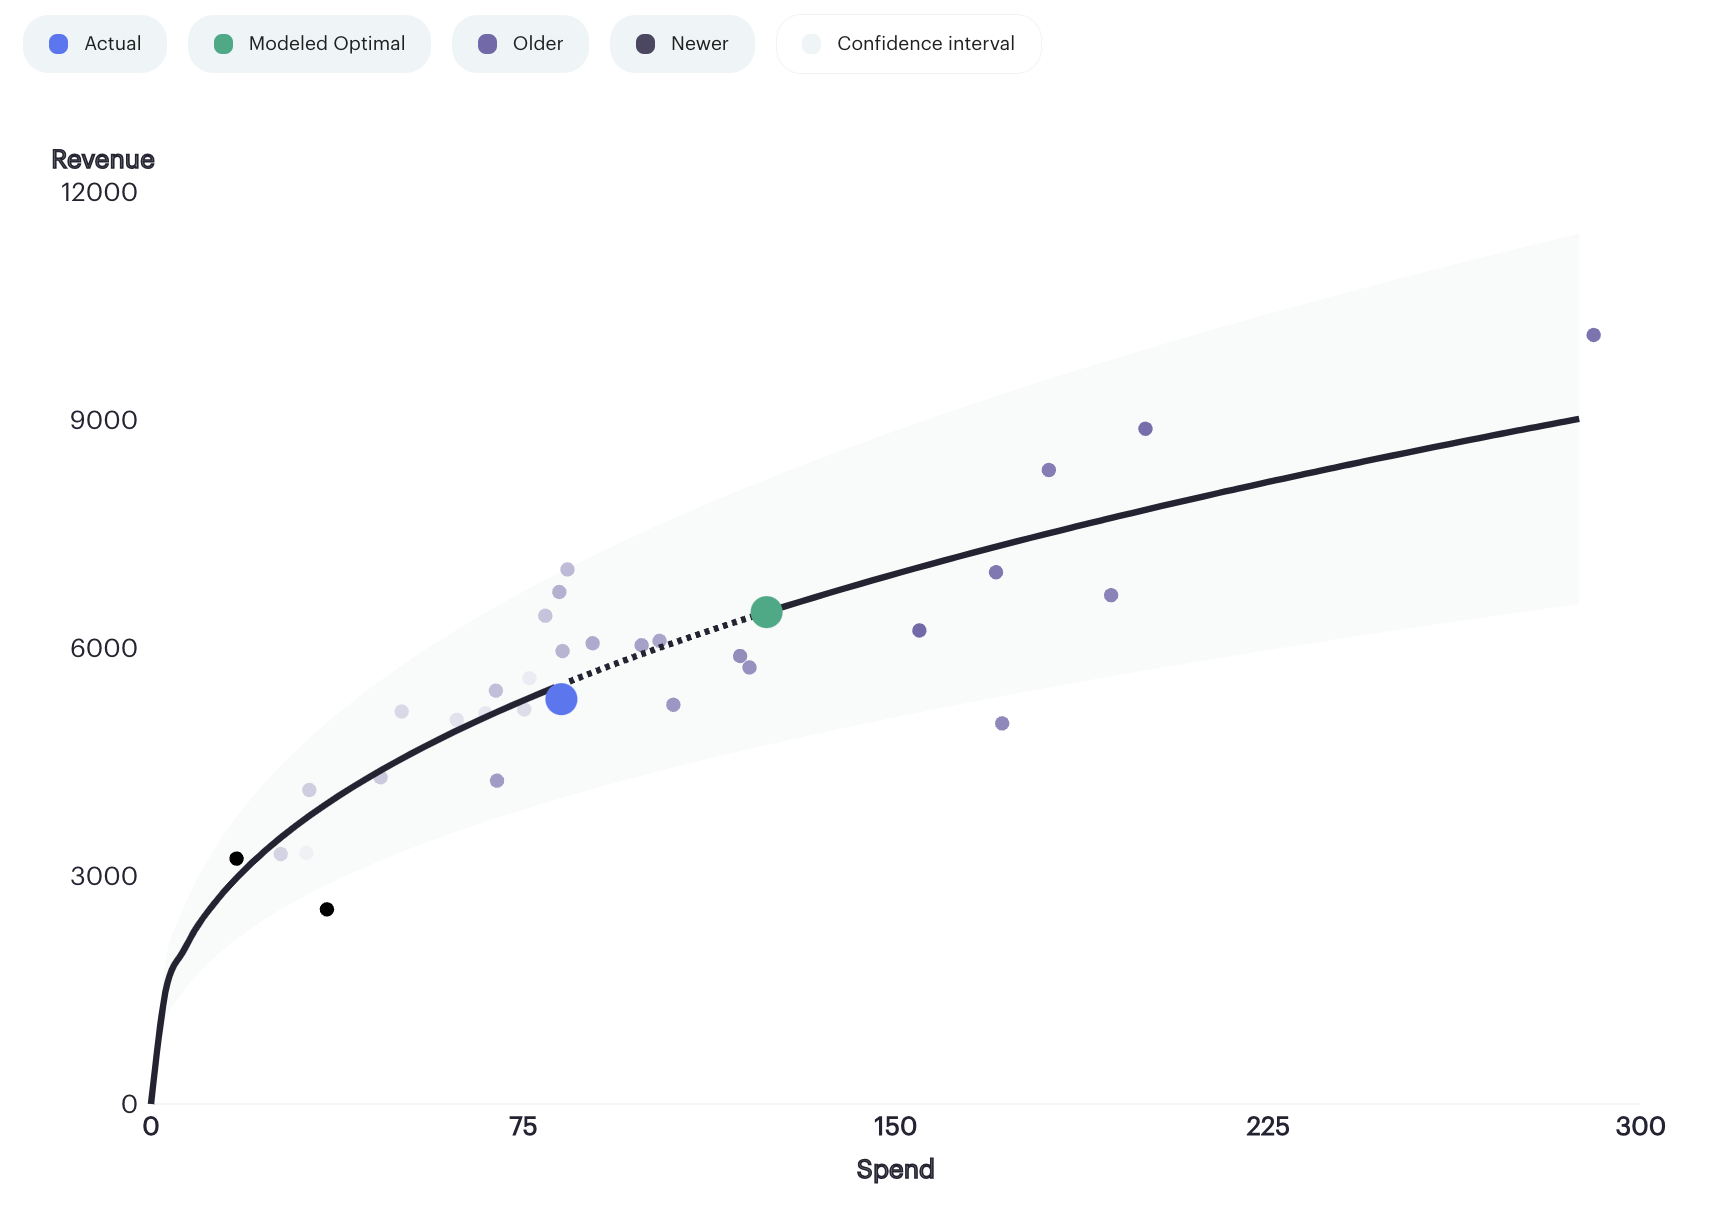
Screenshot from Precis Budget Optimiser, showing the spend / return function for a single campaign. The Blue dot represents actual spend, and the green dot represents the optimal spend.
In this post we’ve used GADS performance planner as an example, but similar tools exist in SA360, Meta etc. Finally, we have our very own Budget Optimiser, that asses marginal returns across all connected campaigns and outputs the optimal budget distribution. Unlike the other tools mentioned above, the Budget Optimiser can also work with a cross channel attribution model, in which case the output is the optimal distribution across all platforms and campaigns to maximise the returns of your investment – a game changer for everyone that struggled to nail the online media mix.
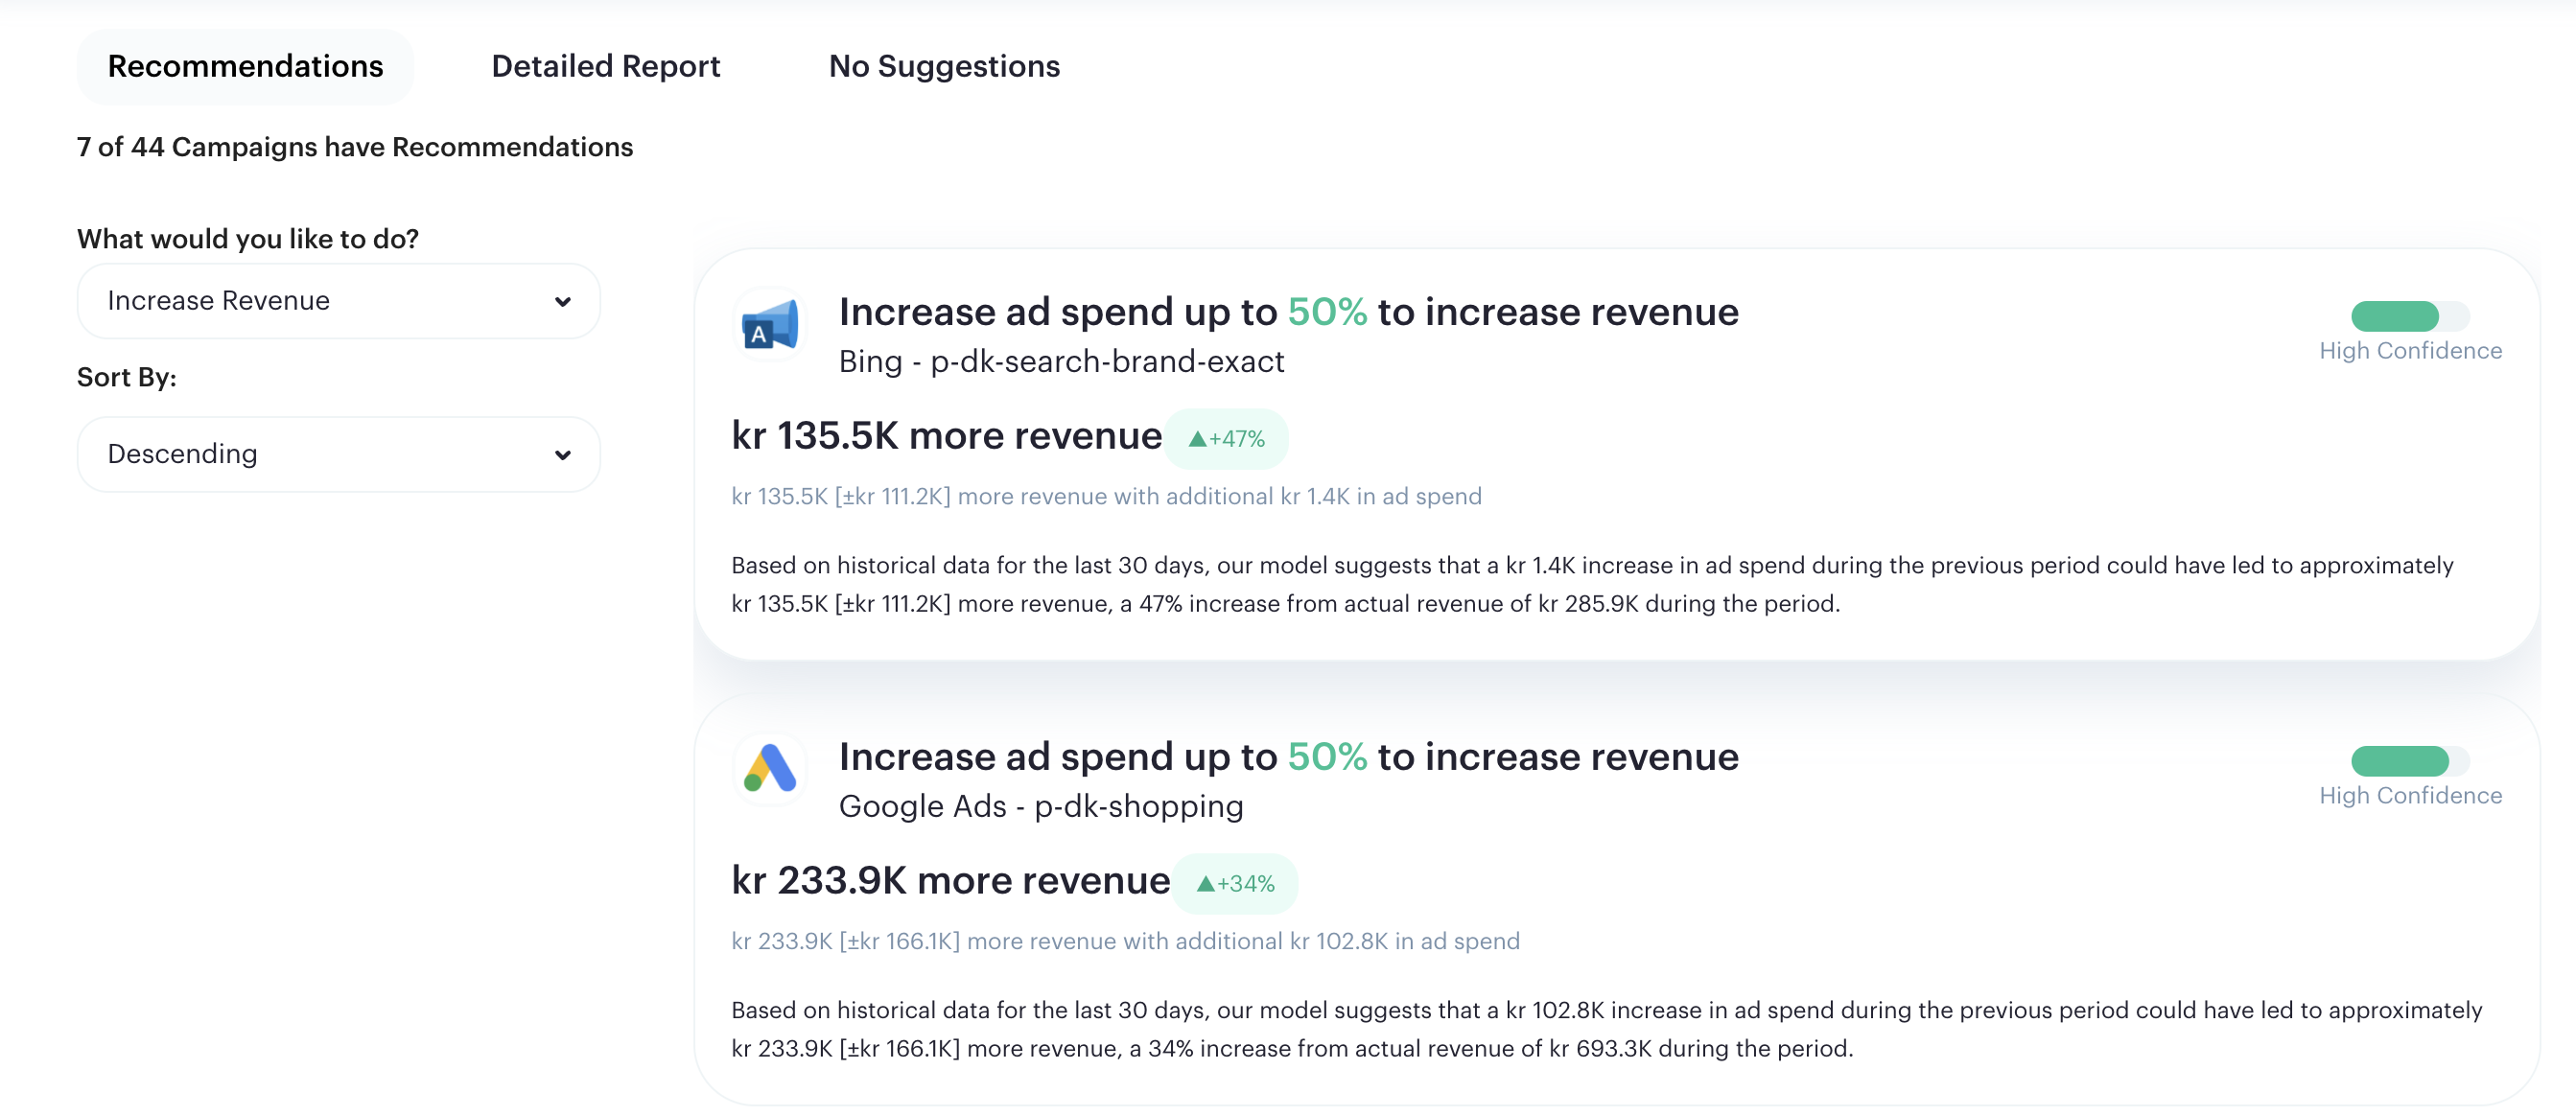
Another Screenshot from Precis Budget Optimiser. In this view we see the most important budget updates to maximise conversions / revenue.
For more Precis recommendations, on tools, strategy or simply stay up to date on latest marketing trends – sign up to our newsletter delivered to your inbox every month.


