Diving into Attribution with Facebook

Robert Jurewicz
Paid Social Lead
Attribution is the process of assigning value to advertising activities and it has been a hot topic in advertising ever since John Wanamaker famously said: “Half the money I spend on advertising is wasted; the trouble is I don’t know which half”. Now, technological advancements provide the possibility to answer this question – and this blog will dive into how to use Facebook’s attribution tools to that effect.
What is attribution and why is it such a big deal?
Within social psychology, attribution is defined as the process by which individuals assign causes to behaviors or effects. This definition translates very well to digital marketing where the outcome i.e. a conversion action, can be attributed to particular marketing activity.
This is, of course, easier said than done. Imagine someone buys a pair of Nike sneakers online – likely thousands of impressions preceded this purchase – yet which ad do we attribute to the purchase?
Correctly attributing your advertising spend is especially important when it comes to accurately mapping and planning your marketing budget. And with the correct attribution model, you won’t be wasting your advertising spend.
Take a deep dive into attribution with our 5 part series on attribution 2.0.
What are the different kinds of attribution models?
Traditionally, there are two main types of attribution models:
- Rule-based models
- Algorithmic (Data-driven) models
Needless to say, having a reliable way of doing attribution allows you to better understand the entire customer journey and assign value to the touchpoints that have the highest impact. Simply put, understanding attribution gives you a competitive edge.
Rule-based attribution models
Rule-based models base attribution on a number of more-or-less arbitrary rules that assign value to different ad touchpoints.
There are a number of popular calculations, but for this example, we will use the positional 30-30 model. The positional model assigns 30% of the value for conversion to the first as well as the last touchpoint in a purchase journey. The remaining 40% of value is attributed to touchpoints in between.
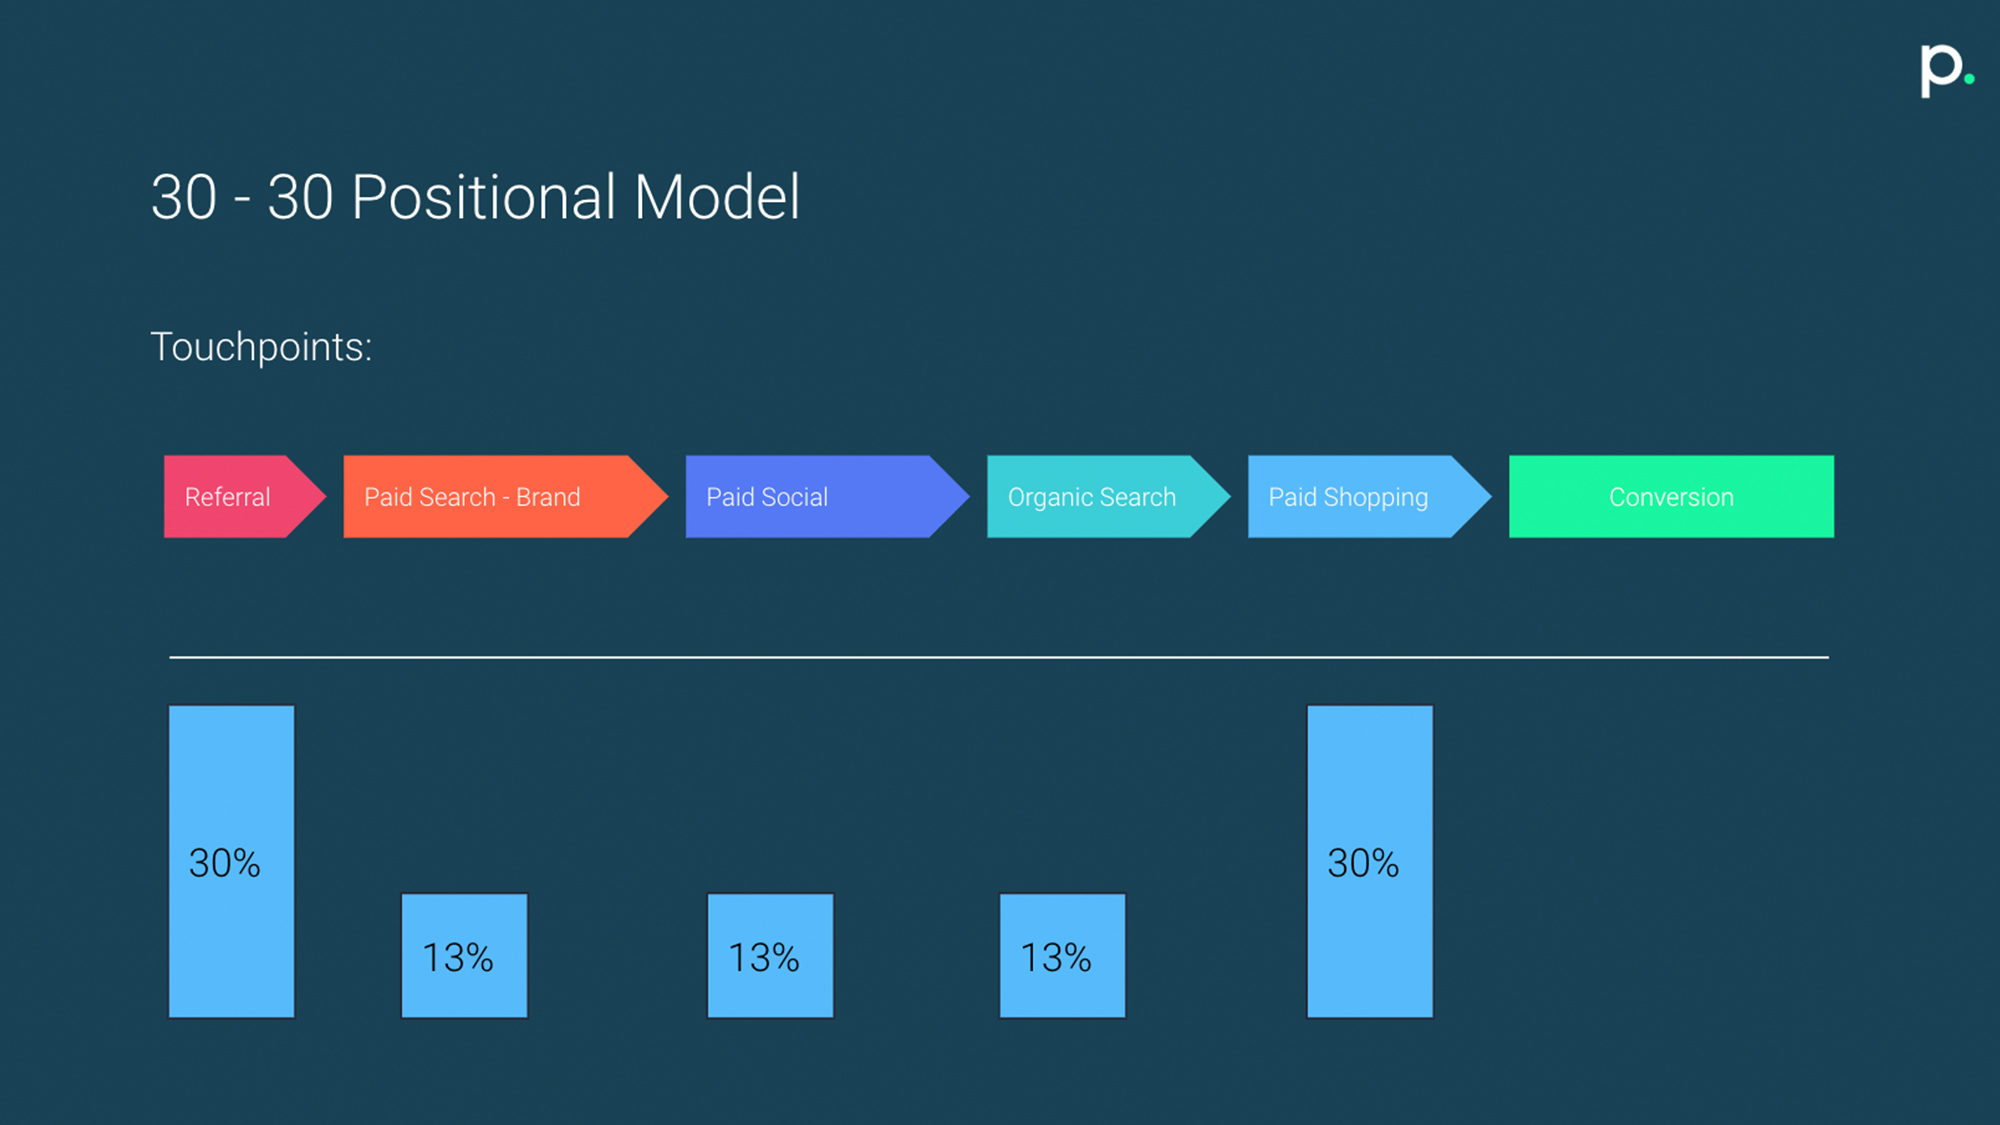
The diagram above shows how a positional model might work. In this case, the initial referral and the final shopping ad are assigned 30% of the value respectively.
So, essentially we give more credit to the touchpoint starting the conversion journey and the one ‘closing’ it.
(Algorithmic) Data-driven attribution models
As the name suggests, these types of models are based on an algorithm that churns through large amounts of data in order to assign value to touchpoints.
Each path to purchase for customers is different, but once you have enough data, this model can start to detect patterns and attribute value this way.
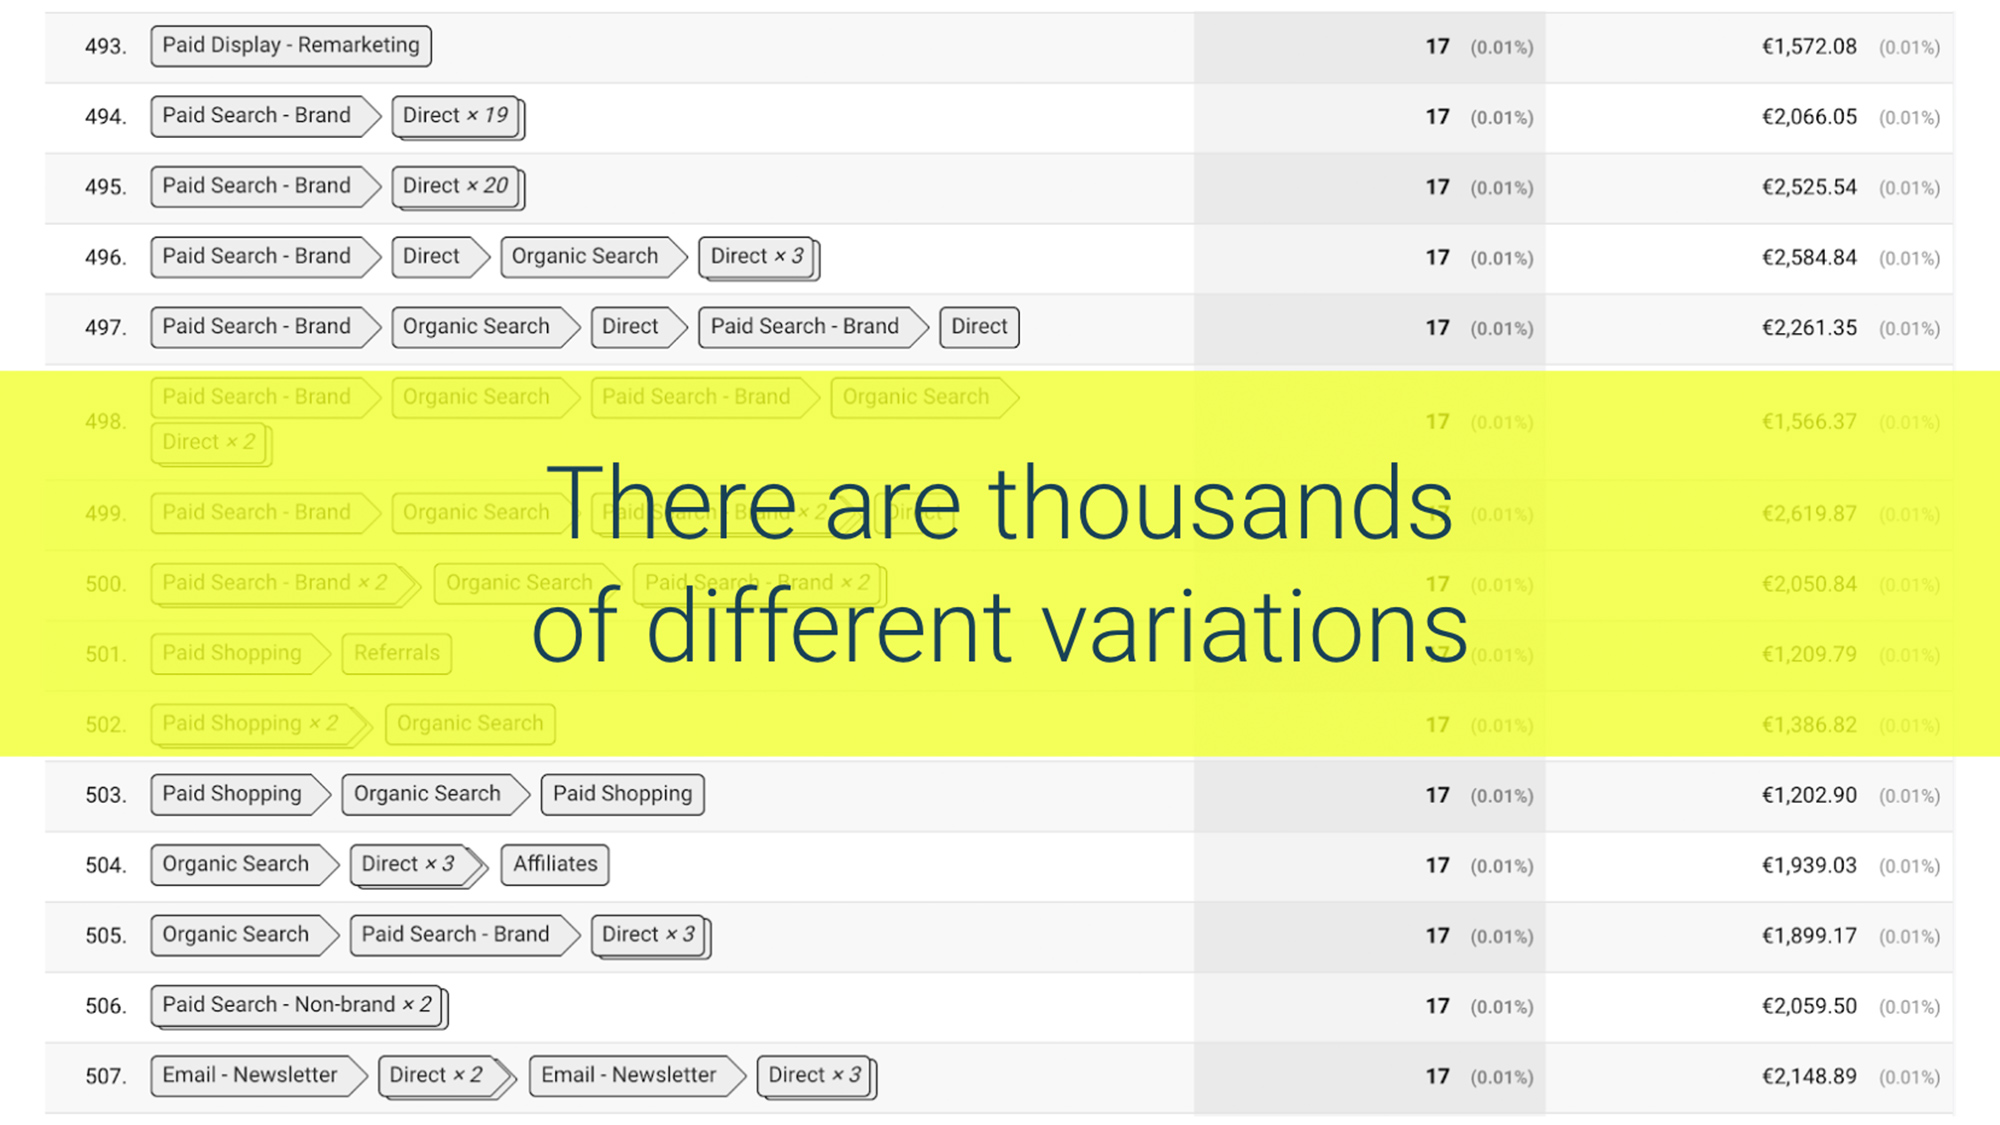
Explaining data-driven attribution can quickly get very technical and mathematical so bear with me for a moment. There are a number of different algorithms and methods to process the different paths but on a general level, most models look at the totality of available paths and assign value to a channel based on how often it is present in the journeys.
Therefore, roughly speaking, if Facebook is present in every converting path then we can be reasonably certain it’s an important channel in our advertising.
Which attribution model should I use for my marketing spend?
In general, data-driven models tend to be more powerful since they avoid making arbitrary assumptions, however, they come with a price. The end result is only going to be as good as the data you feed the algorithm – and mapping every advertising touchpoint to a conversion is no easy feat. Further complexity is added by the duopoly and walled gardens of Google and Facebook. Plus, with upcoming privacy concerns and ever-increasing competition between the two giants, it’s unlikely to get much easier in the near future.
(For more information around balancing google and Facebook attribution models click here).
In some cases, the rule-based attribution model might be a simpler and quicker solution to your attribution problem – even if their accuracy lags behind some algorithmic studies.
Many companies that attempt to build a better understanding of their attribution fail. In pursuing the holy grail of all attribution models, many make the mistake of aiming too high, and then when they realize that not all data is available the project is simply dropped.
The key here is understanding the path to better attribution rather than imagining the output itself. Earlier we defined attribution as the process of assigning value to touchpoints, in advertising, a better definition might be: The process of improving your model for assigning value to touchpoints.
In other words, we shouldn’t be so focused on the outcome itself but rather the focus should be on producing a model that is better than the one we have today.
Using incrementality studies to supplement attribution models
Incrementality is the last key to the attribution puzzle. Remember that attribution tries to assign partial credit to each touchpoint in a series of ad servings. Although this gives us an idea of how much touchpoints are contributing to a purchase, it can’t answer the question, what would happen if they didn’t see any ad at all from x source?
Incrementality should be seen as a framework to answer exactly that question, how many conversions would I have gotten without showing any ads?
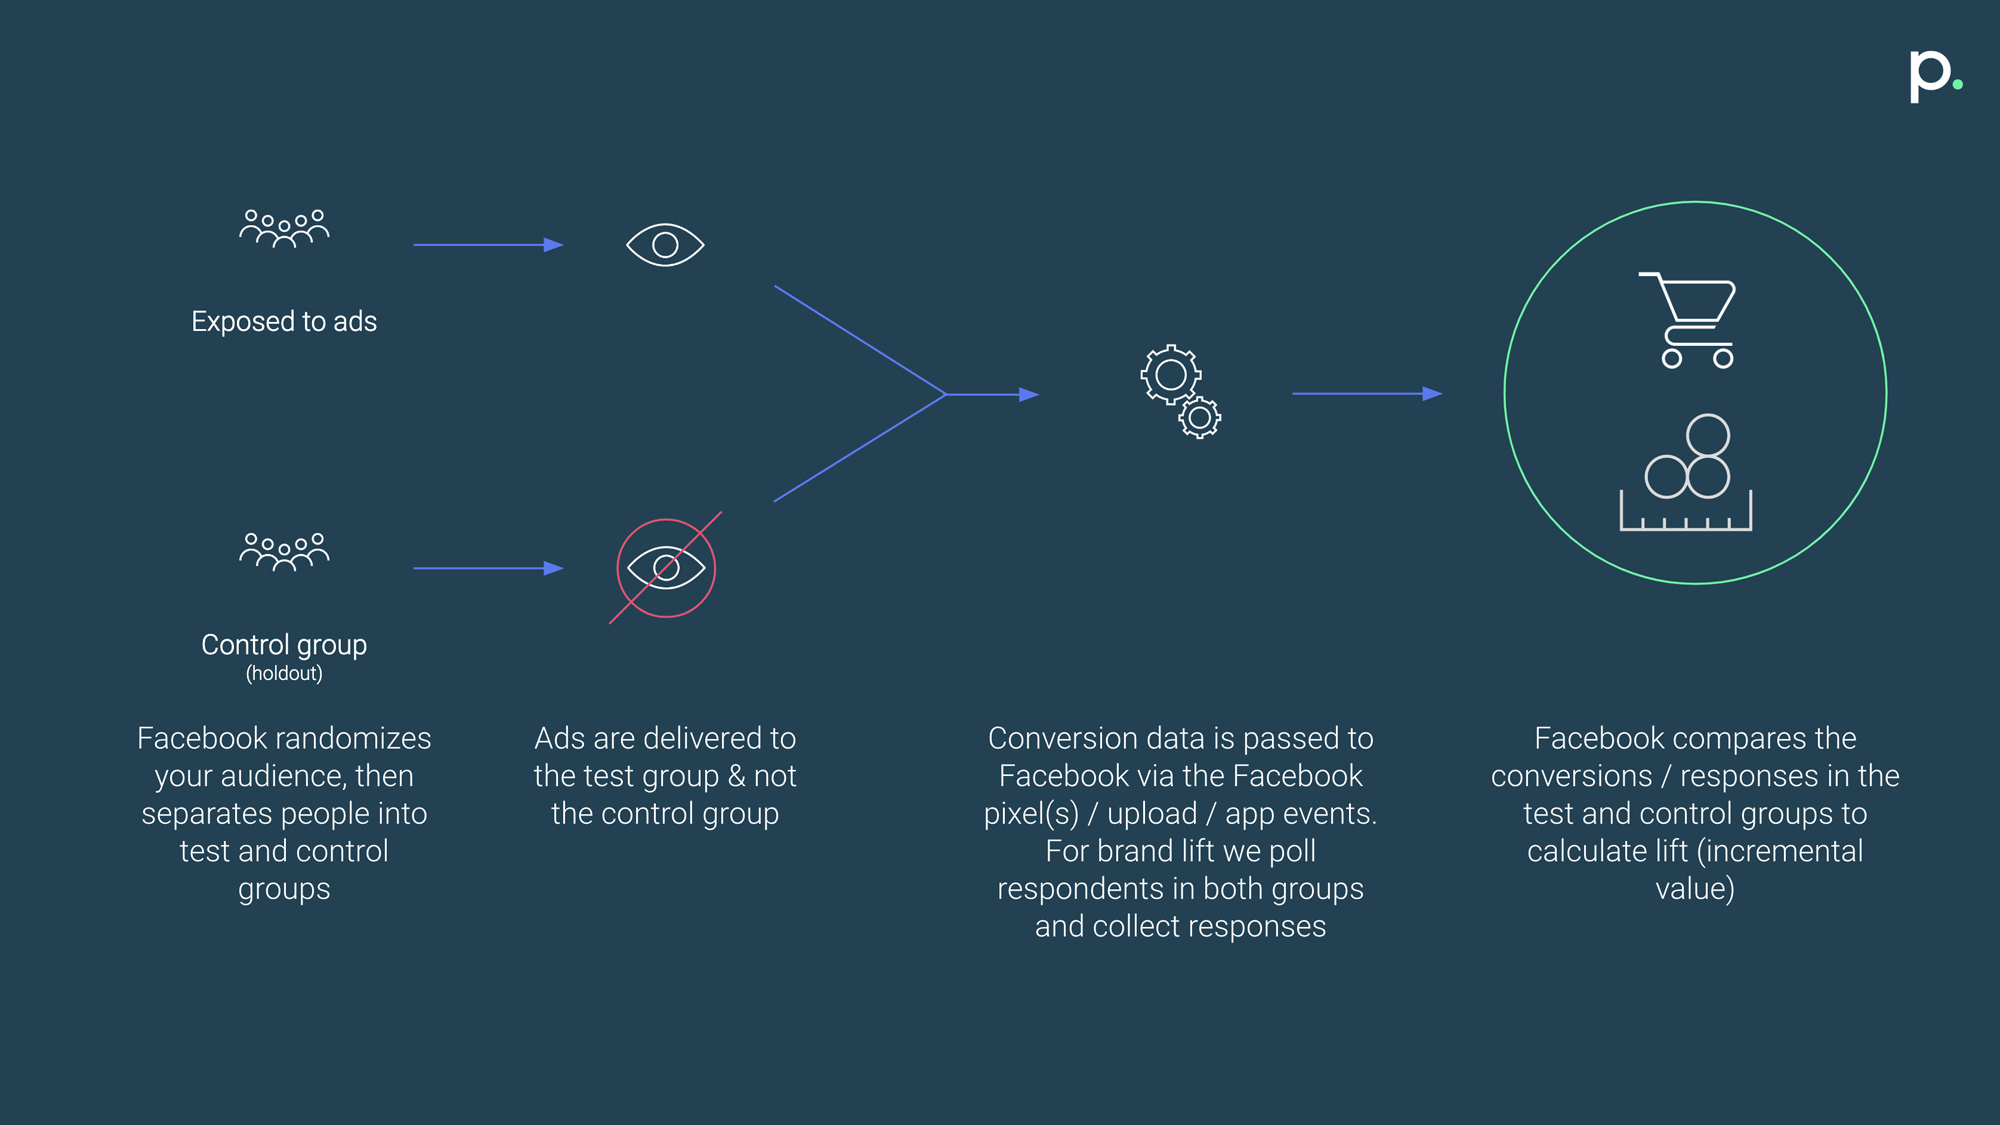
Incrementality is measured in the same way one might perform a scientific study, with a treatment group (users exposed to ads) and a control group (users not exposed to ads) and conversions are measured from each group respectively.
 The benefits of incrementality studies
This type of experiment is called a conversion lift study. There are several reasons why lift-study outputs are so useful for marketers:
- Lift studies are attribution agnostic, it doesn’t matter what models you choose, either a conversion happened or not and that is the only factor that makes a difference in these studies.
- Lift studies can give you a lower limit for how many conversions a channel generated. Since incremental conversions are ones that would not have happened otherwise, incrementality fails to capture the full value of a channel. However, it does give you a benchmark for the lowest possible number of conversions, this is extremely useful when comparing attribution models since it allows you to establish a lower bound.
The drawbacks of incremental studies
- Attribution is an iterative process, we are looking to improve our current understanding and incrementality is the tool we need to make sure we are making correct decisions. While this sounds neat and simple there are a few drawbacks of incrementality which means that it is often impractical to use by itself:
- Incrementality misses any interaction effects that might come from users seeing ads on different platforms.
- Studies can be costly in terms of resources (they require work to set up) as well as time.
- It’s hard to generalize over campaigns, how can you know this result will hold true for the next campaign with different creatives/new communication?
- It is due to these shortcomings incrementality has to be used in conjunction with attribution where incrementality studies are used to confirm insights derived from attribution.
It is better to be roughly right than precisely wrong.
– John Maynard Keynes
Understanding Facebook’s Attribution Tool
With all the theory-crafting out of the way, it’s time to come back down to reality. During 2018-2019, Facebook released a tool available to all advertisers, Facebook Attribution. Like other tools provided by Facebook, this tool is completely free and available to anyone who advertises on Facebook.
So, how does it work?
After going through the necessary setup steps you are met with the performance tab – this shows a basic table of your top sources. The tool itself is still quite limited, reports have limited customization and can’t be exported, and the number of tabs is low. Nevertheless, Facebook Attribution is still in its infancy, and more features will no doubt follow shortly.
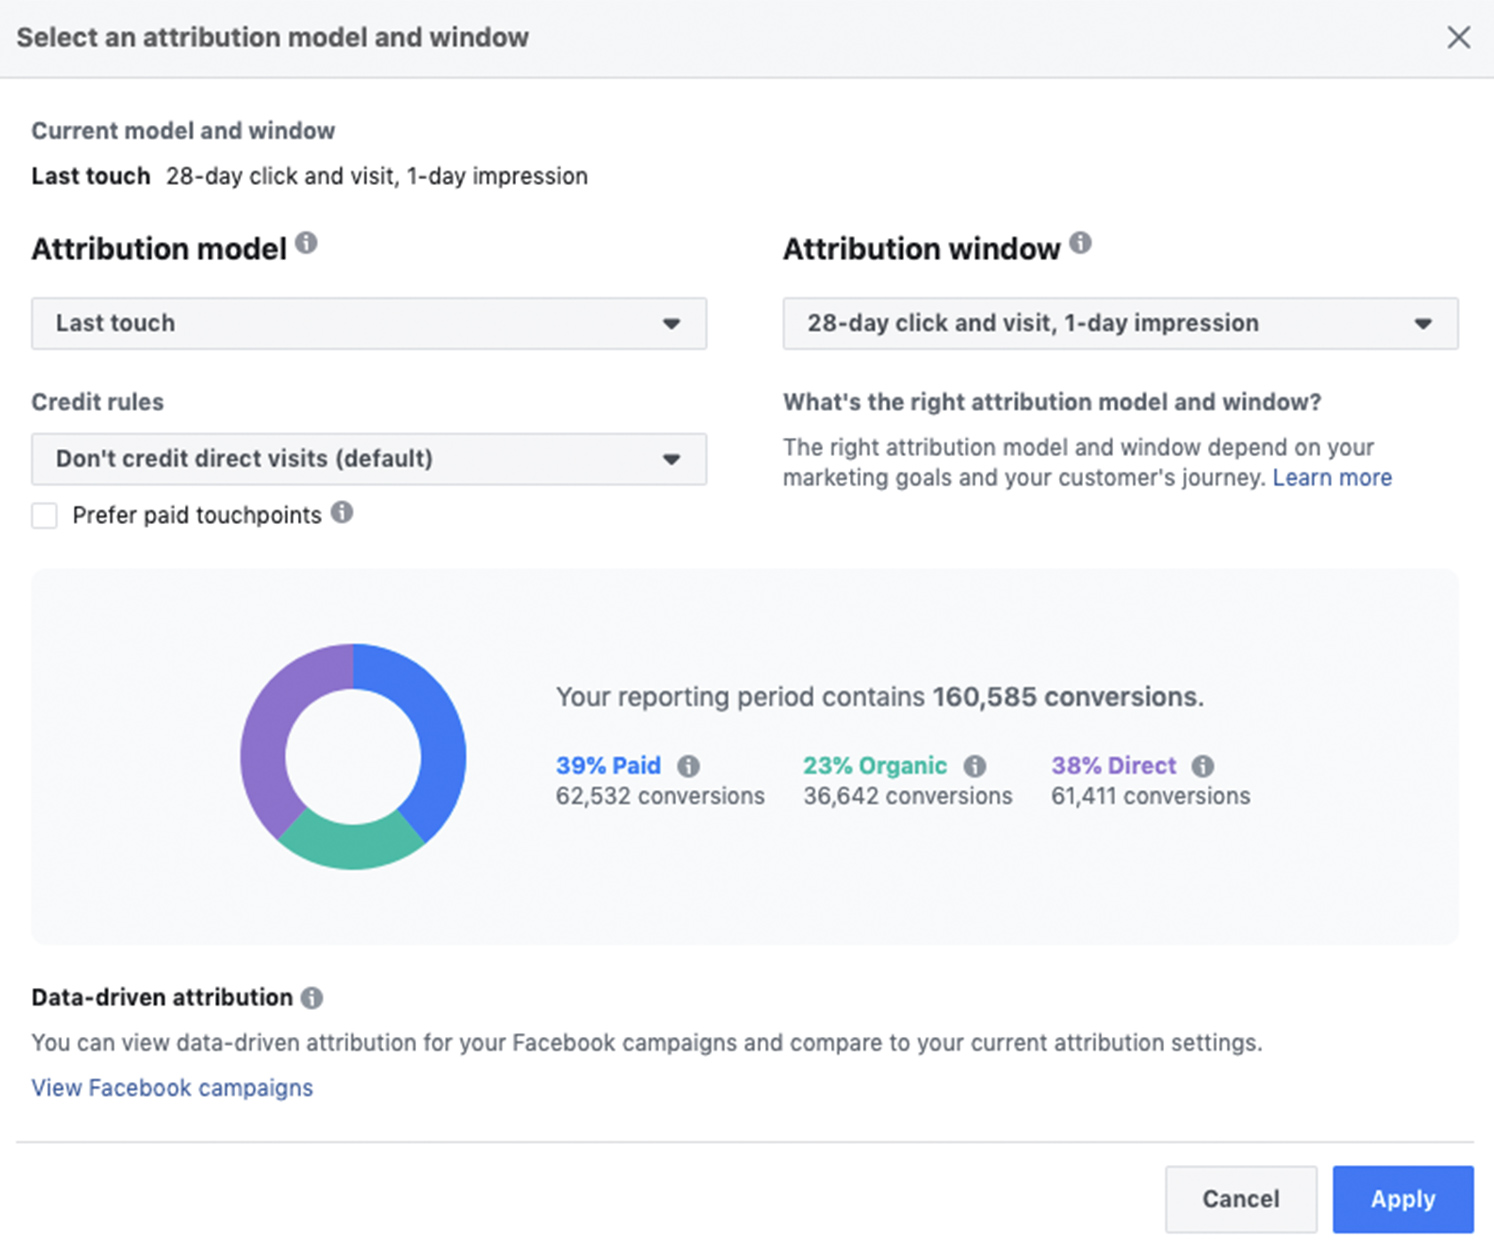
The first interesting feature we come across is somewhat hidden in the top right corner of the interface. Here we can select different attribution models from a series of pre-set rule-based models, as well as pick some settings for those models such as what attribution window to use and whether paid touchpoints should be proportionally weighted heavier.
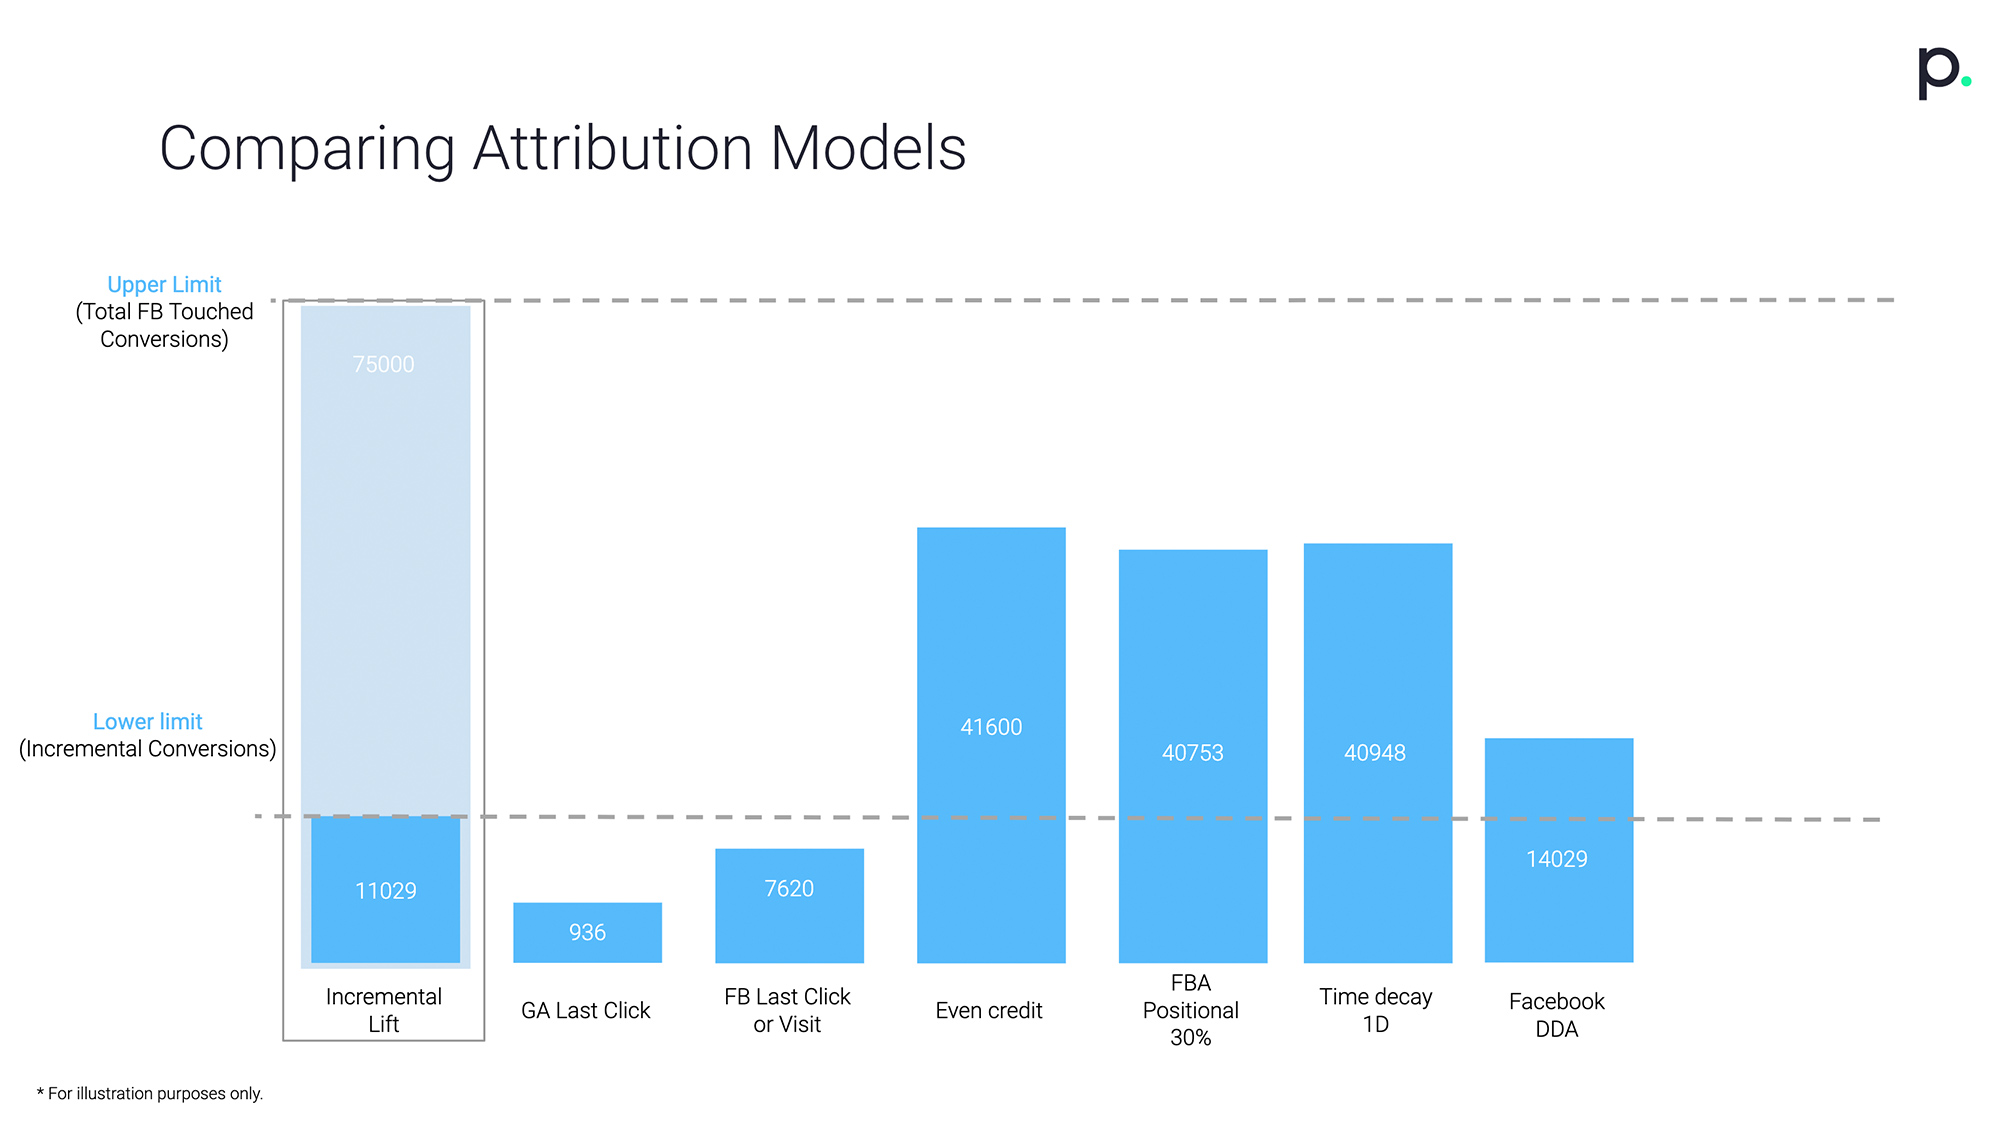
In addition to the rule-based models, Facebook also uses its own data-driven model to re-calculate conversions that Facebook was credited for. A very interesting exercise to do across all of your analytics platforms is to simply compare the output from different attribution models side-by-side as pictured below.
In this case, what we have done is compare the number of conversions Facebook campaigns are credited with based on the different attribution models, we also chose to compare it to GA last click which is still the default for many advertisers today.
There are a few interesting things to point out when doing this type of eyeball analysis:
- The lower limit of conversions credited to Facebook is the output of a conversion lift study which is a great tool to help estimate value derived from Facebook ads.
- The upper limit in this example is the default Facebook last-click model which tends to be overly generous.
- When selecting which model is appropriate for your business, consider the proportion of spend you are putting into the channel (in this case Facebook). If you are spending a majority of your budget on this channel you should likely pick a model that is closer to the top limit, if it’s a minor portion of your budget it’s likely correct to pick a model closer to the lower limit. Consider the amount of data that each model makes available as this will affect your foundation for decision-making.
- Models that consistently show similar results are in practice equivalent. Consider the three models in the above graph which are roughly equal in the number of conversions: even credit, positional 30%, and time decay 1D. Regardless of which of these we chose, our actions are going to be the same, hence we should consider these models equivalent in terms of what actions we will take.
This type of analysis, while quite basic, will still provide good insight. Remember that we are only looking for a model that is better than what we have today rather than perfection. This will help you make more informed decisions when deciding which attribution model you want to use, it’s often very useful to use a rule-based model since while it might be less accurate than some data-driven counterparts it’s quicker to arrive at and quite a bit easier to work with / take action on.
Turning insights to action
If attribution had commandments written on a stone tablet there would likely be only two and it’d likely say something like this:
- Thou shall not pursue perfection but rather an improvement.
- Thou shall not use the power of attribution in vain.
What we mean by this is that attribution should be viewed as a means to an end, not the end itself.
Perhaps the most important question to pose when working on attribution is what actions can we take from this insight?
Let’s go back to the graph above and pretend that we decide to use the positional 30% model to evaluate Facebook results rather than Google Analytics which was previously used. This change would cause us to attribute roughly 4 times greater value to Facebook. Logically, this should also correspond to a proportionally higher investment than before.
This brings us to the key question, seeing these results, would you be willing to invest 4 times more money into a channel? The output of your analysis, in this case, suggests that this is the correct decision to make. But such drastic decisions can be hard, especially without being able to evaluate whether or not it was the right decision.
Luckily Facebook has provided us the tools to answer these types of questions and evaluate if we are making the correct decisions.
A new hope
 Regardless of the current limitations in Facebook Attribution, we have high hopes for the future. Throughout the last decade, the landscape has been largely dominated by Google Analytics which has its own shortcomings that are often overlooked.
(Check out our guide to Google Analytics here.)
As an agency, we see ourselves as a key partner for our clients to help navigate the duopoly of Facebook & Google. Our job is to balance these competing views objectively and generate the most accurate model possible.
Having multiple data-sources to rely on, each with its respective biases makes it easier to uncover the platform bias and adjust accordingly, together with the ability to do experiments on a large scale, we can generate and test attribution models for every client – not just the ones that have the means to run a large-scale project.
If you would like to learn more about our services, including attribution at Precis you can read more here, or get in touch with us to see how we can create actionable insights from your marketing data.

